In this post we look at the one plot that proves that technical analysis is useless.
Technical analysis and horoscopes
As volatility has returned in recent months, investors have sought advice from asset managers and other investment professionals. In many instances, such advice includes technical analysis (TA). Even many highly respected investment firms and financial news sources promote TA:
- Charles Schwab represents TA as an indispensable tool for active traders (examples: here and here).
- Merrill Lynch offers a Market Analysis Technical Handbook.
- Some Bank of America / Merrill Lynch analysts utilize technical analysis: here.
- Fidelity considers TA an advanced technique for professional traders (example: here) and recently hosted a webcast with the “Charted Market Technician Association.”
- E-Trade offers an introduction to TA: here.
- Barrons explains here “Why technical analysis matters.”
- The Wall Street Journal lists many resources for TA: here.
- Bloomberg offers a blog dedicated to TA: here.
- MarketWatch.com offers a blog with a promotion of technical analysis tools: here.
- The Market Realist recommends technical analysis as an investment tool: here.
However, there is no scientific evidence that technical analysis, whether it be practiced by amateur day traders or professional investors, is any more useful than astrology (see below). In fact, a few websites prepare horoscopes for stocks (see here and here), but what technical analyst could argue against them? Once a person suspends reason to accept that any random pattern should be declared a law, then any correlation (including spurious correlations between the stars and stocks) must be sanctioned as causation.
Why is technical analysis promoted?
We can understand that uneducated investors would still believe, in this day and age, that technical analysis is used by “professionals.” But why would the above firms and news outlets promote TA as a legitimate technique without any scientific support? When evaluating fraud, experts often cite the “fraud triangle,” identified in the 1950s by renowned criminologist Donald R. Cressey. The fraud triangle presents three elements that are the basis for fraud: Opportunity, motivation and rationalization. First, the person committing fraud may only do so if he has an opportunity. Second, the person must also have a motivation to commit the fraud, such as greed or need. Third, the person must have a rationalization. He or she does not see himself as a criminal, but justifies the behavior in some way.
Accordingly, there are three reasons why firms may be willing to promote technical analysis:
- Opportunity: TA has the appearance of a sophisticated discipline. And yet, it is trivial enough that a fool could use it. Victims have been willing to fall for it over decades, despite multiple warnings from scientists.
- Motivation: TA triggers a large number of trades, and these firms are built on trading commissions.
- Rationalization: These firms see themselves as delivering what their customers want. In their eyes, the customers want TA, and they simply facilitate that.
We might point out that if an economist, say, or a physicist or an astronomer were to draw conclusions based on a “head and shoulder pattern” or a “fifth wave” in data, he or she would surely be ridiculed by colleagues. And if such talk were employed by a pharmaceutical firm or medical practitioner, they would be guilty of malpractice.
Why technical analysis is useless
Whatever the reasons or rationales behind those who promote technical analysis, the fact remains that there is no evidence that it works — see, for example, our previous blog Charts and technical analysis: Do they work?.
Also, consider the following: Numerous quant funds and other organizations at the forefront of modern quantitative finance employ highly sophisticated mathematical algorithms (much, much more sophisticated and extensive than anything ever used in the TA world), with huge dynamic datasets, implemented on state-of-the-art large-scale computer equipment, and trading at millisecond and even microsecond levels. These computer programs mine every single morsel of real statistical information that they can find in a continual search for “alpha.” Furthermore, these competing quantitative programs are engaged in a very real “arms race,” because any strategy that produces statistically nontrivial profits is quickly mimicked by other programs from other organizations, with a result that any edge enjoyed by one firm or by one computer program evaporates rather rapidly. Indeed, this “war” partly explains why the resulting market price stream is almost entirely a random walk.
So those who promote technical analysis would have us believe that the many highly trained mathematicians and their highly sophisticated computer programs have all somehow missed a few simple, elementary schemes that anyone armed with a computer screen, a plotting program and a handful of simple tools can routinely take advantage of to produce reliable above-market-average profits, month after month, year after year.
Obviously there cannot be any such trivial schemes, any more than there can be some simple rules allowing an astrologer, armed only with a person’s birthdate, to reliably foretell the person’s future character and life events.
The most important plot in finance
 As it turns out, the most important plot in finance is not a technical analysis chart, but one that demonstrates the futility of technical analyses. Every investor should be familiar with it. Understand this plot well, and it will save you a lot of misery. Ignore it, and it may cost you your savings.
Suppose that you are looking for an investment strategy. You run multiple backtests (analyses based on historical market data) on a bunch of ideas, coming up with results that achieve high Sharpe ratios, some of them above 3 (which would appear to be a very promising result). You show these results to your boss, who decides to place the strategy in paper trading for a few weeks. Luckily, paper trading performance seems consistent with the backtest, so the investment committee approves its deployment. The strategy receives a $100 million allocation, but unfortunately a 20% loss follows shortly after. The strategy never recovers, and it is eventually decommissioned, alongside its author. What happened?
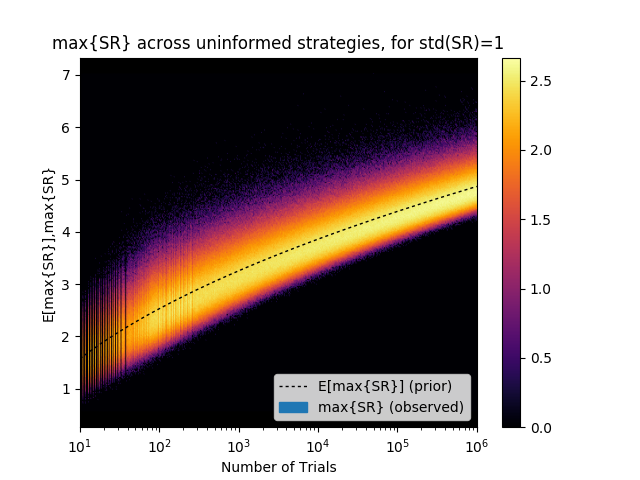
The y-axis of the plot on the right displays the distribution of the maximum Sharpe ratios (max{SR}) for a given number of trials (x-axis). A lighter color indicates a higher probability of obtaining that result, and the dash-line indicates the expected value. For example, after only 1,000 backtests, the expected maximum Sharpe ratio (E[max{SR}]) is 3.26, even if the true Sharpe ratio of the strategy is 0! How is this possible? Why does your backtest achieve such a high Sharpe ratio when the true Sharpe ratio is exactly zero?
The reason is Backtest Overfitting: When selection bias (picking the best result) takes place under multiple testing (running a computer program that explores many alternative configurations), the outcome is very likely to be a false discovery. Finance books, academic journals and TV financial news channels are filled with false discoveries. The retraction rate for journal articles in the finance field is essentially null, compared to thousands of papers retracted in other fields. Most investment firms invest in false positives, and fail, because they do not own (or they fail to implement) the technology to prevent them.
The plot on the right is an experimental verification of the “False Strategy” theorem, first proven in this 2014 NAMS paper. This theorem essentially states that, unless max{SR}>>E[max{SR}], the discovered strategy is likely to be a false positive. Moreover, the theorem is notable for providing a closed-form estimate of the rising hurdle that the researcher must beat as he or she conducts more backtests. The plot confirms that this estimated hurdle (the dash-line) is quite precise under a wide range of trials (in the plot, between 2 and 1,000,000). Read this 2014 JPM paper, to learn more about ways of preventing false discoveries.
The moral
It is trivial to generate good-looking technical analysis (TA) strategies, when you run computer simulations on data without any constraint from rigorous theory. That is how technical analysts produce thousands of examples of presumed “successes.” But of course, for each TA success, there are millions of counter-examples where the same pattern leads to a loss. So the next time someone throws you a TA chart, think about the millions of alternative charts that this person is not showing you, based on alternative model configurations. Under that light, even a Sharpe ratio as high as 5 is to be expected.