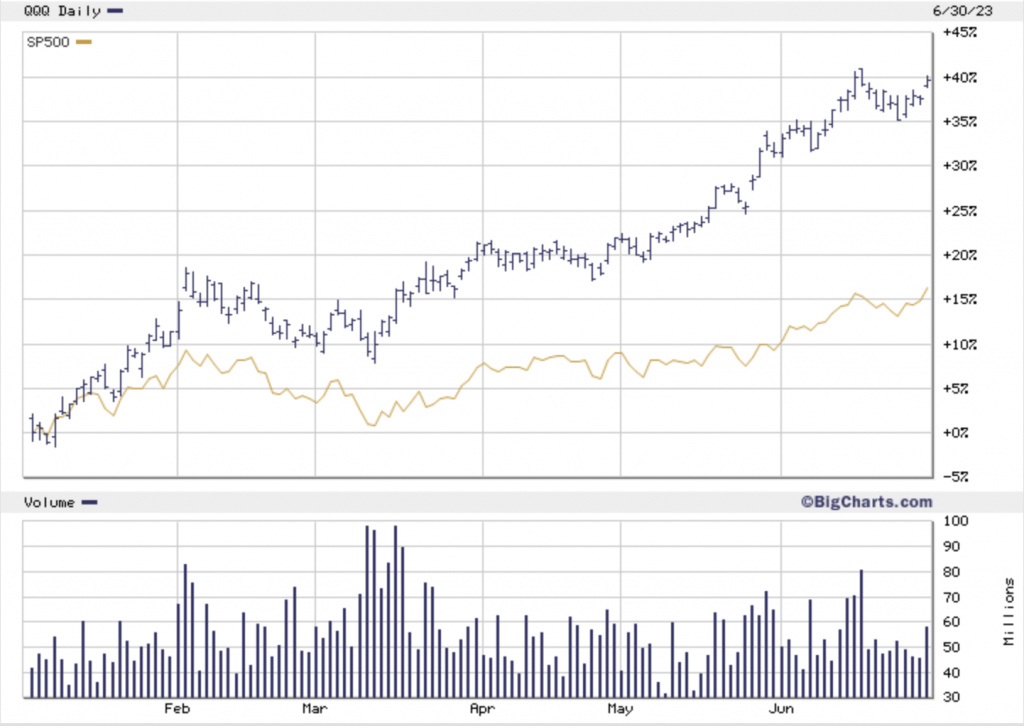
Nasdaq-100 (QQQ) (blue) and S&P500 (orange), Jan-June 2023; courtesy BigCharts
Mid-March 2023
For a moment, let us turn back the clock to mid-March 2023. Here is a brief summary of the financial news current at the time:
- The cryptocurrency community was still reeling from the November 2022 collapse of FTX, led by wunderkind Sam Bankman-Fried. The speed of FTX’s downfall, transpiring over just a few days, stunned the crypto industry, which had long promoted itself as a high-tech means to avoid the risk of traditional banking.
- The U.S. Federal Reserve, defying pleas for mercy from politicians and investors alike, raised its Federal Funds Rate by 50 basis points in December 2022, followed by 25 points in February 2023 and 25 points in March 2023.
- Analysts broadly predicted a recession. Barclays Capital predicted that 2023 will go down as “one of the worst for the world economy in four decades.” Fidelity International stated that a hard landing looks “unavoidable.”
- On 10 March 2023, Silicon Valley Bank, a lender to many tech firms, collapsed after a sudden bank run. The damage was not limited to the U.S., as Swiss banking giant Credit Suisse also collapsed. These failures raised serious questions about numerous other banks in the U.S. and elsewhere.
- Elizabeth Holmes, the former Theranos CEO who was convicted of defrauding investors with a dubious blood testing system, continued legal maneuvers to reduce her 11-year prison sentence. Her conviction led many to wonder how many other tech startups were inflating their claims with the motto “fake it till you make it.”
- Numerous news reports bemoaned that tech moguls had lost their golden touch, and that the era of nonstop innovation had passed. Twitter foundered after being bought out by Elon Musk. Microsoft laid off 10,000 workers. Meta, the parent of Facebook, laid off 10,000. Google laid off 12,000 employees via an email message.
- Major cities in the U.S. and elsewhere reeled from a huge jump in office space vacancy, as office workers who had been working from home during the Covid-19 pandemic refused to return, threatening the solvency of commercial real estate, the viability of many downtown businesses and the property tax revenues of many formerly prosperous cities. San Francisco’s office vacancy rate rose to 30%.
So what did many chart-watching investors, individuals and professionals alike, do? As Vildana Hajric and Katherine Greifeld explained in Bloomberg News, “it looked like a layup”: Take cash out of stocks and invest in short-term bonds and money-market mutual funds, where rates were over 5%. Indeed, investors moved billions of dollars into short-term bonds and money market mutual funds. Exchange traded funds linked to short-dated U.S. treasury securities, such as the iShares 0-3 Month Treasury Bond ETF, increased by USD $5.6 billion, on top of a USD $42 billion inflow in 2022.
A day of reckoning
So as of the current date (1 July 2023), how did this strategy work out? Abominably!
Those chart-watching, market-timing investors who sold stocks and bought bonds or money-market mutual funds in the first quarter of 2023 missed one of the best 3-month stock bull markets in U.S. financial market history: The S&P500 index rose 14% from its low in mid-March through the end of June, and the Nasdaq-100 index rose by 27% — see chart above. In fact the Nasdaq-100 scored it best first half (Jan-June) increase ever, up a whopping 39% over its December 2022 close. Along this line, on the last day of the quarter (June 30), Apple Computer’s market capitalization topped USD $3 trillion, the first company ever to reach this exalted level. Also on June 30, Tesla announced a record-breaking 466,140 vehicles delivered in the second quarter.
As Denitsa Tsekova, Carly Wanna and Lu Wang of Bloomberg News lamented, “Stocks rallied when they were forecast to tumble, expected bond gains fizzled, and the recession never came. … Up and down Wall Street, forecasters were caught flat-footed by how the first half of 2023 unfolded in financial markets.” Paul Krugman, Nobel Prize-winning economist and New York Times columnist, added, “I can’t think of another example in which there was such a universal consensus that recession was imminent, yet the predicted recession failed to arrive.”
It should cautioned, however, that as of this date 2023 is only half over. Significant financial turbulence may still ensue for the remainder of 2023, and it is even possible that the recession that many had earlier predicted will actually materialize, possibly in late 2023 or early 2024, just in time to muddy the 2024 U.S. presidential election.
However, there are significant reasons for optimism. As Carly Wanna and Lu Wang of Bloomberg News report, a boom in artificial intelligence technology is just starting, led by large tech firms and extending to many small firms as well. Further, the economic expansion in the second quarter extended far beyond the tech world, with large gains in travel, homebuilding and entertainment, to name but a few. Consumers in particular seem not to have heard the message about the upcoming recession.
The dismal record of market forecasters
All of this once again raises the question of why are so many investors willing to accept the advice of chart watchers and market forecasters, many of whom employ only mathematically unsophisticated tools, particularly when their record of predictions is so poor? As Jeff Sommer, a financial writer for the New York Times, recently summarized, “as far as predicting the future goes, Wall Street’s record is remarkable for its ineptitude.”
Sommer noted that in December 2019, the median consensus of an ensemble of prominent Wall Street analysts was that the S&P 500 index would rise 2.7% in 2020. The result was up 15% — a forecasting error of 12 percentage points. But that is only part of the story. In April 2020, after the market crash in March, the revised consensus of a Bloomberg survey of analysts was that the market would fall 11% overall for the calendar year. So the final result (up 15%) was really off by 26 percentage points.
In an earlier column, Somer mentioned the analysis of Paul Hickey of Bespoke Investment Group. According to Hickey’s analysis of market forecasts since 2000 (see also Hickey’s technical article):
- On average, the median December forecast was that the S&P 500 would rise 9.8% in the next calendar year; the actual average rise was 5.5%.
- The average gap between the median forecast and the actual S&P 500 was 4.31 percentage points, i.e., an error of 44%.
- Each year, the median forecast was for a rise in the S&P 500 index; but it fell in six years, i.e., it was fundamentally wrong in direction 30% of the time.
Hickey observed that these forecasts were off by the most when they would have mattered the most. For example, in 2008 the median forecast was for a rise of 11.1%. The actual performance? A fall of 38.5%, i.e., a whopping error of 49.6 percentage points.
Kaissar’s analysis of market forecasters
Nir Kaissar analyzed a set of predictions by market forecasters over a 17-year period from 1999 through 2016. He found that although there was a modest correlation between the average forecast and the year-end price of the S&P 500 index for the given year, these predictions were surprisingly unreliable during major shifts in the market.
For example, Kaissar found that the strategists overestimated the S&P 500’s year-end price by 26.2 percent on average during the three recession years 2000 through 2002, yet they underestimated the index’s level by 10.6 percent for the initial recovery year 2003. A similar phenomenon was seen in 2008, when the strategists in his study overestimated the S&P 500’s year-end level by a whopping 64.3 percent in 2008, but then underestimated the index by 10.9 percent for the first half of 2009.
In other words, as Kaissar lamented (independently of Hickey), the forecasts were least useful when they mattered most.
Our analysis of market forecasters
In 2017, the present author, together with three other colleagues, completed an analysis of the records of prominent U.S. market forecasters. For this study, we expanded on a 2013 study conducted by the CXO Advisory Group, which ranked 68 forecasters. We analyzed these 68 forecasters based on two additional factors: (a) the time frame of the forecast (forecasts are categorized as up to one month, up to three months, up to nine months or beyond nine months); and (b) the importance and specificity of the forecast.
The results of our analysis are available in this technical paper. The average score was 48% — i.e., not significantly difference from chance. Among the 68 forecasters in our study were 27 who employ technical analysis in their work. So how well did these 27 technical analysts do? Their average prediction score was 44.1%, slightly less than the average of all 68 forecasters in our study.
In other words, there is no evidence whatsoever in these data that these forecasters can predict better than chance. If anything, our results must be on the optimistic side, because of the well-known survivorship bias phenomenon — very likely numerous unsuccessful forecasters have dropped out of the business, and thus are absent from our data.
What should individual investors do?
All of this once again raises the question of why so many investors, professionals as well as individuals, are willing to accept the advice of chart watchers and market forecasters, many of whom employ only mathematically unsophisticated tools (note the “technical analysis” chart in the Bloomberg report mentioned above), particularly when their past record of predictions is unambiguously poor?
As we have explained in earlier articles, one should not be too surprised at these findings, since they are a straightforward implication of the efficient market hypothesis (see also this report and this interview): In an era where markets are increasingly dominated by large, mathematically sophisticated, machine-learning-powered players with huge computer systems and datasets, it is virtually impossible for relatively unsophisticated forecasters and investors to consistently beat the markets. The efficient market hypothesis has some weaknesses, but beating the market say based on market psychology requires that one has a superior grasp of mass psychology effects in financial markets, which can hardly be assumed by individual forecasters, let alone by individual investors.
So what do writers such as Sommer and leading experts in the field recommend, particularly for individual investors with their 401K and IRA accounts? As we have emphasized before in these articles, the majority of individual investors would do well to simply follow the advice of Vanguard Funds founder Jack Bogle, Berkshire Hathaway founder Warren Buffett and Dimensional Fund Advisors co-founder David Booth: invest in one or a handful of low-cost index funds (or, alternatively, a modest-sized diverse collection of individual stocks and/or bonds), selected according to a sober analysis of appropriate risk and time frame, perhaps with the assistance of a qualified professional, and, most importantly, hold these investments for the long term — studiously avoiding the temptation to buy or sell based on day-to-day market fluctuations or commentaries.
As David Booth commented, “We don’t try to forecast the future. … We have no ability to do it. Nor does anyone else.”