Holiday season is coming and so is holiday related investment advice. Right before Halloween (31 Oct 2013), the Halloween Indicator emerged in the Wall Street Journal online site suggesting that during the six months from Halloween (October 31) to May Day (May 1), the market has a higher return compared to the other six months.
Eager to find out how much edge this indicator will provide, we compared a buy-and-hold-the-DJIA strategy from 1915 to 2012 versus taking a position only during the six-month period from October 31 to May 1. The equity curve for these two strategies both starting with one unit invested beginning in May 1915 is illustrated in the graph below, in log scale. Surprise! The red curve, corresponding to the strategy of following the Halloween Indicator, underperforms buy and hold significantly.
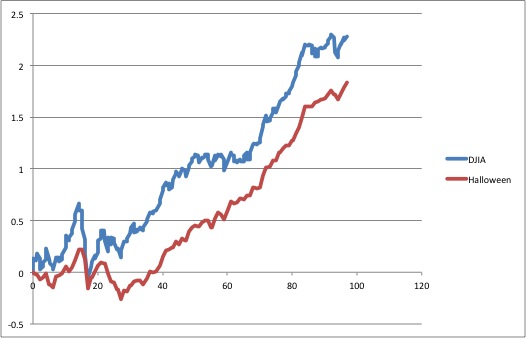
Buy-and-hold DJIA vs. Halloween strategy
Could it be that the Halloween Indicator helps one obtain better risk-adjusted performance? While there are many measures of risk-adjusted performance, the most favored in the financial industry is the Sharpe ratio, which is defined as the ratio of the mean historical excess return over a risk-free asset, normalized by one standard deviation. Since we are comparing two strategies, using the excess return over cash will do.
It turns out the Sharpe ratios for the two strategies differ only when get to the third decimal: 0.275 and 0.279, respectively, where the Halloween Indicator’s ratio is 0.279. Such a slight edge will certainly not warrant calling it an “indicator,” especially when it underperforms the simple buy-and-hold-DJIA method by a wide margin. We suspect the discoverer of this indicator was looking at a shorter and more recent time period.
To be thorough, we divided the 98 years of DJIA data into ten periods each containing 10 years (the last one has only 8 years left), and then calculated the Sharpe ratios for each period. We were very much amused by the results (see the table below). The Halloween Indicator suggested a strategy that outperformed the buy-and-hold-DJIA strategy in exactly 5 of the 10 periods, which of course, is precisely what one would expect at random. Surprise!
It is true that this indicator happens to yield a better Shape ratio in the most recent 18 years. But promoting an investment strategy according to test on a small section of historical data is exactly the recipe for overfitting. Testing a strategy on a sufficiently long timeframe is one of the ways we suggested in our recent paper Pseudo-mathematics and financial charlatanism: The effects of backtest overfitting on out-of-sample performance to prevent overfitting errors.
Although the chance of making money using the Halloween Indicator is no better than flip of a coin, as we showed above, one thing is for certain: more such indicators will emerge with the holiday season and throughout the year and continue year after year. Watch out!
| Period | Buy and Hold | Halloween Ind |
| 1915-1925 | 0.3208 | 0.1058 |
| 1925-1935 | 0.1524 | 0.1032 |
| 1935-1945 | 0.2383 | Negative return |
| 1945-1955 | 0.6232 | 0.4725 |
| 1955-1965 | 0.4710 | 0.5010 |
| 1965-1975 | 0.0151 | 0.2279 |
| 1975-1985 | 0.3051 | 0.4043 |
| 1985-1995 | 0.7579 | 0.6363 |
| 1995-2005 | 0.4403 | 0.5795 |
| 2005-2012 | 0.3456 | 0.5091 |