According to a recently-published article on “early warning indicators,” the gain or loss of the S&P500 index (a widely cited metric of the U.S. stock market) during the seven trading days around the new year (the last five days before and the first two days after the new year) predicts the performance of the index for the entire coming year with 85% accuracy. An accuracy level at 85% is very high by any standard. Nevertheless, scientifically literate investors will find this claim unsatisfactory.
First of all, the period over which this indicator is tested is not specified. More importantly, if one is to make an investment decision based on this indicator, will he/she outperform, for example, the simple strategy of buying and holding the S&P500 index, say by buying an exchange-traded fund (ETF) tied to the index (of which there are many)?
These questions are not hard to settle using a few lines of computer program code, given the most recent 50 years of S&P500 index data. It turns out the indicator was correct for 31 out of the 50 years, which is a 62% accuracy level. This is not as glorious as 85%, but it is not bad either.
But one should also ask whether a typical investor can utilize this indicator to achieve positive investment results over the long run.
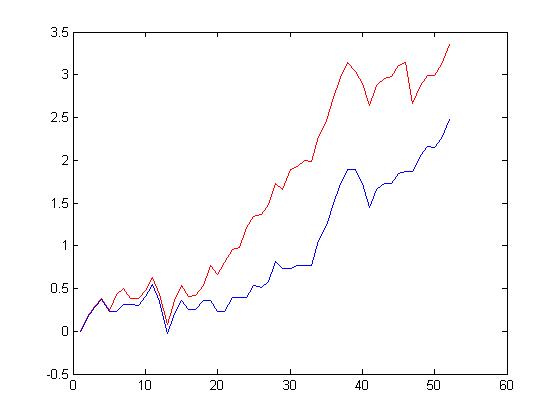
Since shorting is hard to implement by most individual investors, we tested the strategy that after seeing the results of the indicator, one either invests in the S&P500 index starting at the end of the second trading day of the new year, when the indicator is positive, or else, if the indicator is negative, sits on cash for the entire year (for simplicity, we ignored the cost of trading). The cumulative gain of this strategy is shown in the following graph, in log scale (blue curve), compared with simply buying and holding the S&P500 index (red curve). The strategy of using the early warning indicator underperformed considerably!
This result, together with our earlier posts on the Halloween indicator and the Large-small cap stock anomaly, expose a pervasive problem in modern investing, namely the lack of mathematical-statistical rigor in most investment recommendations. In the majority of cases, the claim in question can be checked with only minimal effort for someone with access to data, but such checks are seldom done. Instead, these claims are often recycled again and again in different venues by different authors, who do not fully appreciate the potential for error.
Moreover, we might add that the lack of careful mathematical-statistical validation is reflected in the vague language used in this type of article. For example, given some “rule” or “indicator,” exactly what financial decision is to be made based on the rule or indicator? How soon after the indicator is observed is the decision to be implemented? For how long should the decision be maintained? When should it be changed or reversed? Such key details are seldom included, making it difficult to decisively test or falsify the claim in question.
It thus appears that we have a long way to go to raise the scientific literacy level of the investing community. We hope that the articles on this blog can help.