It’s time for another look at the performance of hedge funds. Recent years have not been kind to hedge funds — not only has overall performance been less than stellar (particularly after fees), it has even lagged the S&P 500 index.
But what if we take a longer-term perspective? After all, the past eight years have been a bull market. What has happened in down markets?
A 28-year data comparison
One widely cited index for the hedge fund world is the HFRI Fund Weighted Composite Index (HFRI FWI), which is published by Hedge Fund Research, Inc. of Chicago. It includes results for all US dollar dominated equity hedge funds (except for some “funds of hedge funds”) with at least USD$50 million in total assets. Here is a table of results, compared with the S&P 500 index (with reinvested dividends) from 1990 through August 2018. The column “HFRI FWI YTD” shows the yearly fractional change in the HFRI FWI index (i.e., the percentage change divided by 100). “Cumulative” means the cumulative value of the index, normalized to Jan 1990 = 1.0000. The data for the S&P 500 index is similar.
| Year | HFRI FWI YTD | Cumulative | S&P 500 YTD | Cumulative | Year | HFRI FWI YTD | Cumulative | S&P 500 YTD | Cumulative |
|---|---|---|---|---|---|---|---|---|---|
| 1990 | 0.0581 | 1.0581 | -0.0310 | 0.9690 | 1991 | 0.3219 | 1.3987 | 0.3047 | 1.2643 |
| 1992 | 0.2122 | 1.6955 | 0.0762 | 1.3606 | 1993 | 0.3088 | 2.2191 | 0.1008 | 1.4977 |
| 1994 | 0.0410 | 2.3101 | 0.0132 | 1.5175 | 1995 | 0.2150 | 2.8067 | 0.3758 | 2.0878 |
| 1996 | 0.2110 | 3.3989 | 0.2296 | 2.5671 | 1997 | 0.1679 | 3.9696 | 0.3336 | 3.4235 |
| 1998 | 0.0262 | 4.0736 | 0.2858 | 4.4020 | 1999 | 0.3129 | 5.3483 | 0.2104 | 5.3282 |
| 2000 | 0.0498 | 5.6146 | -0.0910 | 4.8433 | 2001 | 0.0462 | 5.8740 | -0.1189 | 4.2674 |
| 2002 | -0.0145 | 5.7888 | -0.2210 | 3.3243 | 2003 | 0.1955 | 6.9206 | 0.2868 | 4.2778 |
| 2004 | 0.0903 | 7.5455 | 0.1088 | 4.7432 | 2005 | 0.0930 | 8.2472 | 0.0491 | 4.9761 | 2006 | 0.1289 | 9.3103 | 0.1579 | 5.7618 | 2007 | 0.0996 | 10.2376 | 0.0549 | 6.0781 |
| 2008 | -0.1903 | 8.2894 | -0.3700 | 3.8292 | 2009 | 0.1998 | 9.9456 | 0.2646 | 4.8424 |
| 2010 | 0.1025 | 10.9650 | 0.1506 | 5.5717 | 2011 | -0.0525 | 10.3893 | 0.0211 | 5.6892 |
| 2012 | 0.0636 | 11.0501 | 0.1600 | 6.5995 | 2013 | 0.0913 | 12.0590 | 0.3239 | 8.7371 |
| 2014 | 0.0298 | 12.4183 | 0.1369 | 9.9332 | 2015 | -0.0112 | 12.2793 | 0.0138 | 10.0703 |
| 2016 | 0.0544 | 12.9472 | 0.1196 | 11.2747 | 2017 | 0.0859 | 14.0594 | 0.2183 | 13.7360 | 2018 (Aug) | 0.0200 | 14.3406 | 0.0994 | 15.1013 |
Analysis
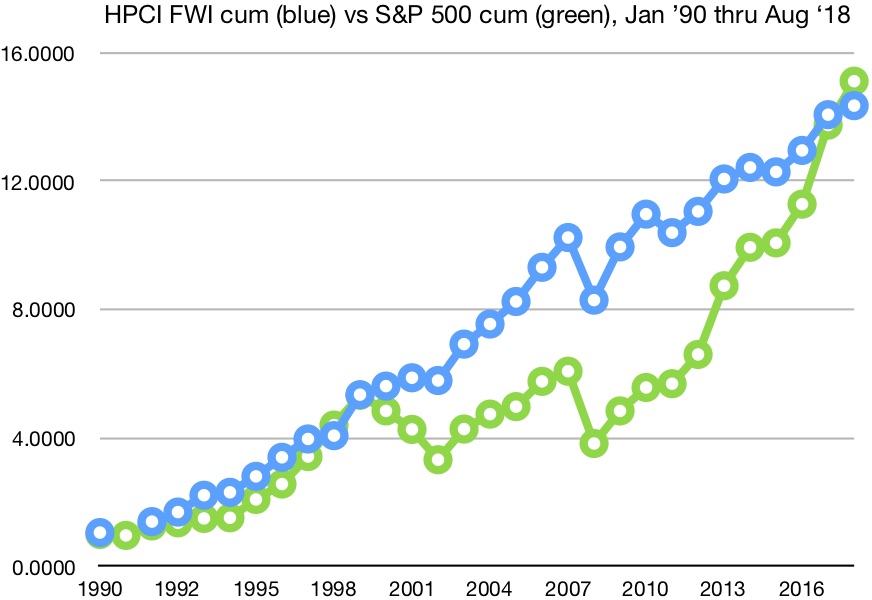
This information is shown graphically in the chart at the right.
What is most striking in this data (table or chart) is that after 28 years, the cumulative performance is about the same — they differ by only 5.3% (the S&P 500 is slightly ahead). Thus over the long run the two approaches appear to be quite comparable.
The other point is that were it not for a divergence in the 2000-2002 period, the two curves would largely coincide, although the S&P 500 curve increases more steeply over the past eight years. The year 2002 offers a particularly stark contrast: the HFRI FWI index dropped only 1.45%, but the S&P 500 dropped 22.10%. In total, over the three year period 2000-2002, the HFRI FWI increased 9.23%, while the S&P 500 dropped 37.61% (these figures are obtained by dividing the year-end HFRI FWI cumulative figures from 2002 by those from 1999, and similarly for the S&P 500). One other difference is that over the semi-bull period 2002 through 2007, the HFRI FWI increased somewhat faster than the S&P 500.
Interestingly, while the HFRI FWI weathered the 2001 bear market quite well, it did not do as well during the 2008 bear market, losing 19% in that year alone. But if it is any comfort, the S&P 500 did even worse, losing 37%.
In general, it is a fair statement that the HFRI FWI index exhibits significantly less volatility than the S&P 500, in agreement with the overall objective of many hedge funds that they avoid the severe declines that periodically afflict the market indices.
The past eight years were not good for hedge funds
Ever since the 2008 crash, however, hedge funds have not done very well compared with the S&P 500. In fact, if we normalize each to 1.00 at the end of 2007, then the HFRI FWI has increased only by 40.08% (i.e., by a factor of 1.4008), whereas the S&P 500 has increased by a whopping 148.45% (i.e., by a factor of 2.4845). Such grim statistics have led many clients to leave the hedge fund world.
A recent Bloomberg report summarizes the carnage. Here are declines in assets for a few funds:
- Paulson, down from $38B in 2011 to $8.7 in 2018.
- Pershing Square, down from $18.3B in 2015 to $8.3B in 2018.
- Brevan Howard, down from $40B in 2013 to $8B in 2018.
- Tudor, down from $22B in 2008 to $7B in 2018.
- Fir Tree, down from $13B in 2015 to $7B in 2018.
- Greenlight, down from $12B in 2015 to $5.5B in 2018.
With regards to performance, it is amusing to recall Warren Buffett’s recent ten-year bet with the manager of a hedge-fund-of-funds, pitting a S&P 500 index fund in competition with a basket of hedge-funds-of-funds. In the end (January 2018), it was no contest — the S&P 500-tracking index fund’s average annual gain was 8.5% (125.8% overall ten-year gain), compared with 6.5% (87.7% overall) for the best fund-of-fund among the five in the contest; on average the five funds-of-funds gained only 2.96% (36.3% overall).
Is it fair to compare hedge funds with the S&P 500?
In a recent article (31 May 2018), Cliff Asness of AQR argues that it is not really fair to compare hedge funds with the S&P 500. The main difficulty is that, as we noted above, the past eight years, say, omits any period of significant correction. He writes that such comparisons are typically “done over a cherry-picked time period,” leading to distortion.
Nonetheless, his analysis shows that even when a comparison is done more properly, “hedge funds have petered out in the last third to half of my sample, adding little to no value.” He concludes
I find the story that hedge funds as a whole are now much closer to regular old traditional active stock picking, and thus less special than before, quite plausible. Given traditional active stock picking is such a consistent long-term disappointment, this ain’t good.
What will happen in the next correction?
In general, it is clear that the real test of hedge funds will come in the next significant correction. Will they weather this correction better than the market indices such as the S&P 500, or even better than, say, a 60%-40% mix of equites and bonds? We will see.
In the meantime, it is worth noting that some hedge funds continue to earn excellent returns. As this Bloomberg report points out, several hedge funds have done very well during the period 2014 through 2018. Millennium is up approximately 75%; Ren Tech is up an impressive 145%; and Two Sigma is up a whopping 180%. In general, as the Bloomberg authors point out, most of the high-performing hedge funds employ “algorithmic” techniques.
Market prophets
All of these results are consistent with a thesis that we have emphasized before (see this Forbes article, also Blog A and Blog B): The easily mined gold is long gone. Today’s markets are increasingly dominated by high-tech quant operations that utilize sophisticated mathematical algorithms and large datasets, typically running on powerful supercomputers, to ferret out any actionable regularities or correlations, and which act on these phenomena in real time. Thus players such as hedge funds are increasingly betting against a time series that is (almost) entirely random noise.
There are still opportunities for real positive-alpha investing. But, as we have emphasized before, these typically require advanced algorithms, high-tech machine learning techniques and access to big data. In other words, go high-tech, with big data, or leave the market to those who do.