
Credit: Wikimedia
The reproducibility crisis in science
Recent public reports have underscored a crisis of reproducibility in numerous fields of science. Here are just a few of recent cases that have attracted widespread publicity:
- In 2012, Amgen researchers reported that they were able to reproduce fewer than 10 of 53 cancer studies.
- In 2013, in the wake of numerous recent instances of highly touted pharmaceutical products failing or disappointing when fielded, researchers in the field began promoting the All Trials movement, which would require participating firms and researchers to post the results of all trials, successful or not.
- In March 2014, physicists announced with great fanfare that they had detected evidence of primordial gravitational waves from the “inflation” epoch shortly after the big bang. However, other researchers subsequently questioned this conclusion, arguing that the twisting patterns in the data could be explained more easily by dust in the Milky Way.
- In 2015, in a study by the Reproducibility Project, only 39 of 100 psychology studies could be replicated, even after taking extensive steps such as consulting with the original authors.
- Also in 2015, a study by the U.S. Federal Reserve was able to reproduce only 29 of 67 economics studies.
- In an updated 2018 study by the Reproducibility Project, only 14 out of 28 classic and contemporary psychology experimental studies were successfully replicated.
- In 2018, the Reproducibility Project was able to replicate only five of ten key studies in cancer research, with three inconclusive and two negative; eight more studies are in the works but incomplete.
P-hacking
Part of the problem is due to abuse of the p-test, a widely used significance test introduced by the British statistician Ronald Fisher in the 1920s. It assesses whether the results of an experiment are more extreme that what would one have given the null hypothesis. The smaller this p-value is, argued Fisher, the greater the likelihood that the null hypothesis is false. The p-test, used alone, has significant drawbacks. To begin with, the typically used level of p = 0.05 is not a particularly compelling result. In any event, it is highly questionable to reject a result if its p-value is 0.051, whereas to accept it as significant if its p-value is 0.049.
The prevalence of the classic p = 0.05 value has led to the egregious practice that Uri Simonsohn of the University of Pennsylvania has termed p-hacking: proposing numerous varied hypotheses until a researcher finds one that meets the 0.05 level. Note that this is a classic multiple testing fallacy of statistics: perform enough tests and one is bound to pass any specific level of statistical significance. Such suspicions are justified given the results of a study by Jelte Wilcherts of the University of Amsterdam, who found that researchers whose results were close to the p = 0.05 level of significance were less willing to share their original data than were others that had stronger significance levels (see also this summary from Psychology Today).
For additional details and discussion, see this Math Scholar blog.
A statistical crisis in finance
Before researchers and practitioners in the mathematical finance field start feeling smug at these reports, it must be emphasized that finance has its own problems in this area, which the present authors argue are even more severe than those in psychology, sociology, economics, biomedicine and physics.
In 2014, one of the present authors and co-authors called attention to the pervasiveness of backtest overfitting in finance. Indeed, backtest overfitting is now thought be a principal reason why investment funds and strategies that look good on paper often fail in practice — the impressive performance that was evident in backtest studies is not reproduced, to put it mildly, when the fund or strategy is fielded in practice.
Some of us also demonstrated, in a 2017 JOIM paper, how easy it is to design a stock fund, based on backtests, that achieves virtually any desired goal (e.g., a steady increase of 1% per month growth, month after month for ten or more years). However, when such designs are presented with new data (as if one were actually fielded), they prove to be very brittle, often failing catastrophically, or, at the least, utterly failing to achieve their stated goal. The reason is, once again, backtest overfitting.
There is no indication that the situation has improved since these early studies. If anything, the situation has worsened with the ever-increasing prevalence of computer-based designs for investment funds and strategies. This is because it is an increasingly simple matter to explore thousands, millions or even billions of alternative component weightings or parameter settings for an investment fund or strategy, and select only the highest-scoring combination to be fielded. As we have shown (see here for instance), such computer explorations (typically never disclosed to editors, readers or customers) render the resulting study or financial product hopelessly overfit and, in many cases, subject to catastrophic failure.
As one of the present authors and a colleague has found, most investment strategies uncovered by practitioners and academics are false.
In a 2018 Forbes interview, two of the present authors, interviewed by Brett Steenbarger, discussed this growing crisis:
Imagine that a pharmaceutical company develops 1000 drugs and tests these on 1000 groups of volunteer patients. When a few dozen of the tests prove “significant” at the .05 level of chance, those medications are marketed as proven remedies. Believing the “scientific tests”, patients flock to the new wonder drugs, only to find that their conditions become worse as the medications don’t deliver the expected benefit. Some consumers become quite ill and several die.
Clearly, there would be a public outcry over such deceptive practice. Indeed, that is precisely the reason we have a regulatory agency and laws to help ensure that medications have been properly tested before they are offered to the public. … [But] no such protections are offered to financial consumers, leaving them vulnerable to unproven investment strategies. … These false positives are particularly misleading, as they are promoted by researchers with seemingly impeccable research backgrounds—and who do not employ the scientific tools needed to detect such false findings.
P-hacking and backtest overfitting
Is there a connection between p-hacking and backtest overfitting? You bet there is.
After all, both p-hacking and backtest overfitting are instances of the multiple testing fallacy — if one performs enough tests or explores enough hypotheses on a single dataset, one is certain to find a test or hypothesis that is successful to any pre-specified level of statistical significance.
 This is perhaps best illustrated by the following graph. As we argued in an earlier Mathematical Investor blog, every investor should be familiar with it. If one understands this plot well, it will prevent a lot of misery. If one ignores it, and it may result in substantial financial loss.
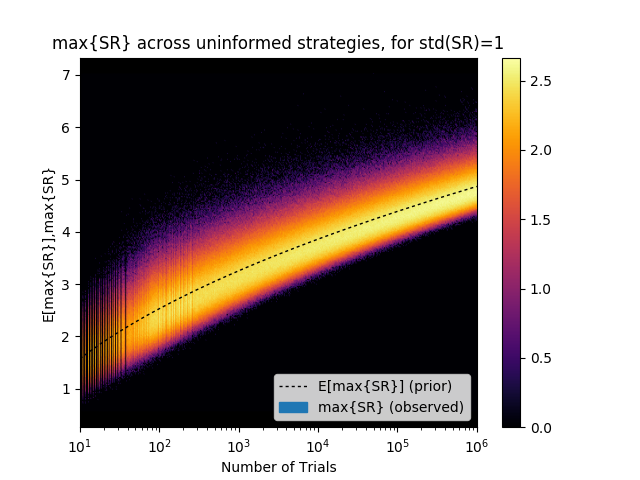
Suppose that you are an analyst for a large investment firm, and you have an idea for a new strategy. You run backtests on a moderately large number of parameter combinations, and find that a few of these parameterized strategies achieve high Sharpe ratios, some of them above 3 (which is typically taken as a rather promising result). You show these results to your boss, who performs independent tests that confirm your result. The investment committee then approves the deployment of what appears to be the most promising strategy, and the strategy receives a $100 million allocation. Unfortunately a 20% loss follows shortly after. The strategy never fully recovers, and it is eventually dismissed, along with its author. What happened?
The y-axis of the plot on the right displays the distribution of the maximum Sharpe ratios (max{SR}) for a given number of trials (x-axis). A lighter color indicates a higher probability of obtaining that result, and the dash-line indicates the expected value. For example, after only 1,000 backtests, the expected maximum Sharpe ratio (E[max{SR}]) is 3.26, even though the true Sharpe ratio of the strategy is zero. How is this possible?
The reason, of course, is backtest overfitting, or, in other words, selection bias under multiple testing.
By the way, this plot is an experimental verification of the “False Strategy” theorem, first proven in this 2014 NAMS paper. This theorem essentially states that, unless max{SR} (the maximum Sharpe ratio) is much greater than E[max{SR}] (the expected value of the maximum Sharpe ratio), the discovered strategy is likely to be a false positive. Moreover, the theorem is notable for providing a closed-form estimate of the rising hurdle that the researcher must beat as he or she conducts more backtests. The plot confirms that this estimated hurdle (the dash-line) is quite precise under a wide range of trials (in the plot, between 2 and 1,000,000).
Ending the crisis
Fortunately, there are some specific tools that can be used to prevent the deleterious effects of backtest overfitting and related multiple testing errors. For example, this 2014 JPM paper provides some solid ways to detect and prevent false discoveries. Also, this 2017 JCF paper provides a theoretical framework to calculate the probability of backtest overfitting. Many of these techniques and others are discussed in the recently published book Advances in Financial Machine Learning.
In the Forbes article (mentioned above) on the growing crisis in modern finance, one of us argues that additional government regulation and oversight may be required, in particular to address the extent to which retail investors are not aware of the potential statistical pitfalls in the design of investment products.
But in the end, the only long-term solution is education — all researchers and investment practitioners in finance need to be rigorously trained in modern statistics and how best to use these tools. Special attention should be paid to showing how statistical tests can mislead when used naively. Note that this education needs to be done not only for students and others entering the work force, but also for those who are already practitioners in the field. This will not be easy but must be done.
The American Statistical Association, in a 2019 statement, after recommending that p-values not be used except in rigorously analyzed contexts, concludes
Good statistical practice, as an essential component of good scientific practice, emphasizes principles of good study design and conduct, a variety of numerical and graphical summaries of data, understanding of the phenomenon under study, interpretation of results in context, complete reporting and proper logical and quantitative understanding of what data summaries mean. No single index should substitute for scientific reasoning.
No royal road
Such considerations bring to mind a historical anecdote from the great Greek mathematician Euclid. According to an ancient account, when Pharaoh Ptolemy I of Egypt grew frustrated at the degree of effort required to master geometry, he asked his tutor Euclid whether there was some easier path. Euclid is said to have replied, There is no royal road to geometry.
The same is true for mathematical finance: there is no “royal road” to reliable, reproducible, statistically rigorous financial analysis, particularly in an era of big data. Those researchers who learn how to deal effectively with this data, producing statistically robust results, will lead the future. Those who do not will be left behind.